

A link-in-bio page is often treated as profile housekeeping. In practice, it is a routing layer between social attention and business action. It decides which offer people see, where they go next, and whether interest becomes measurable value.
That is why total clicks are a weak measure on their own. A page can attract heavy traffic and still underperform because the wrong audience arrives, the strongest link is buried, the destination breaks the promise, or the final action is not tracked. Useful analysis starts with a harder question: what did the page help visitors do, and what did that action contribute?
The Bio Link as a Routing Layer
Social platforms compress a brand or creator into a profile, a short description, and one main link. That link becomes the bridge between a fast-moving feed and a more deliberate decision.
The page may direct visitors to a product, newsletter, booking form, event, article, portfolio, or affiliate offer. Combining those destinations creates convenience, but it also makes them compete for attention.
A visitor arriving after a product demonstration expects to find that product immediately. Someone coming from an educational post may be looking for a guide or newsletter. A job prospect may want a portfolio. A returning customer may need support. The page is therefore not a neutral list. It is a prioritization system.
Its analytics should show whether the right people arrived, whether they could identify a relevant next step, and whether the destination produced the intended result. Success is not equal click distribution. It is sending the right visitor to the right place with minimal confusion.
Set a Measurement Contract
Before opening a dashboard, define what the page is expected to achieve during the reporting period. This is the measurement contract.
A measurement contract connects a business objective with a visitor action and a method of verification. It prevents teams from changing the definition of success after seeing the numbers.
| Business objective | Visitor action | Proof of success |
| Grow a newsletter | Complete the sign-up form | Confirmed subscriber in the email platform |
| Sell a product | Complete checkout | Recorded transaction and revenue |
| Generate consulting leads | Submit a relevant enquiry | Lead accepted into the sales process |
| Promote an event | Purchase or reserve a ticket | Completed registration |
| Build an audience | Visit a priority channel | Verified referral or tracked follow action |
The contract should identify one primary outcome and a few supporting signals. A product launch may use purchases as the primary outcome, while product clicks, checkout starts, and email sign-ups act as supporting signals.
This distinction matters because supporting activity can rise while the real result declines. More people may click a product link, yet fewer may buy because the traffic is poorly matched or the offer has weakened. A clear contract keeps reporting tied to a decision rather than whichever metric happens to look strongest.
Map the Measurable Journey
Link-in-bio analytics becomes valuable only when the journey is measured beyond the page. A typical path looks like this:
Social content → profile → bio-page visit → destination click → completed action → later value
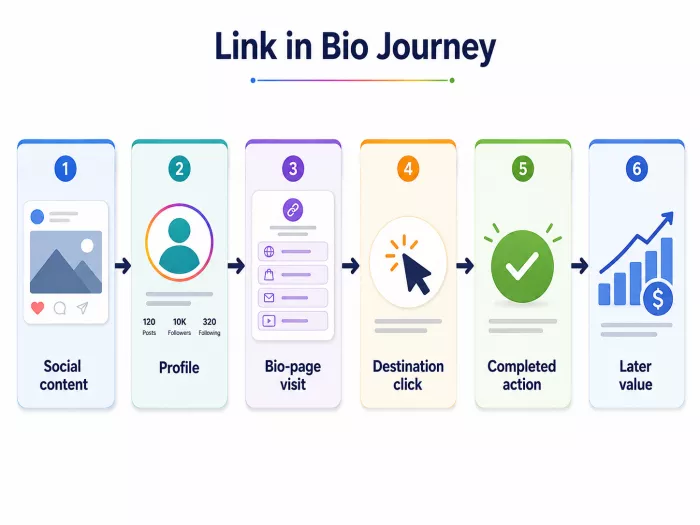
Each handoff can lose visitors or weaken attribution. A social platform may report profile activity without identifying the exact post that caused it. A link-in-bio tool may record button clicks but not purchases. An ecommerce or booking platform may record conversions without preserving the original source.
Document which stages can be measured reliably and where the evidence becomes incomplete. A practical map should include the source platform, content or campaign identifier, bio-page visit, first link selected, destination session, completed action, and any later value such as a repeat purchase.
This exercise exposes tracking gaps. If clicks are measured but submitted forms are not, the page can only be judged as a traffic source, not a lead generator. If purchases are recorded without campaign identifiers, revenue is visible but cannot be assigned confidently.
Perfect tracking is rarely available. The objective is to know where the evidence is strong and where conclusions require restraint.
Judge Arrival Quality
Traffic volume is easy to report and easy to misread. A sharp rise in visits may look positive, but its value depends on who arrived and why. Traffic from a viral entertainment post may behave differently from traffic generated by a tutorial, review, webinar, or recommendation.
Separate total visits from unique visitors, first-time visitors from returning visitors, and organic traffic from paid, affiliate, or partner traffic. Then segment visits by platform, content format, campaign, device, and location where relevant.
Unique visitors show audience size more clearly than total views. Returning visitors may indicate reconsideration, repeat use, or difficulty completing an action. Their meaning depends on the page objective.
Source quality matters more than source size. Suppose Instagram sends 10,000 visitors at a 1 percent purchase rate, while YouTube sends 2,000 at a 4 percent rate. Instagram creates more purchases, but YouTube produces four times the conversion efficiency per visitor.
The difference may come from intent. A detailed review can educate a buyer before the click, while a short video may create curiosity without commitment. Traffic analysis should reveal which sources send visitors who understand the offer and complete valuable actions.
Measure the Decision on the Page
Once visitors arrive, the page must help them choose. The strongest page-level measures describe the relationship between visits, choices, and link distribution:
Page click-through rate: The percentage of page visitors who click at least one link.
Individual link click-through rate: The percentage who choose a specific destination.
Click share: The percentage of all clicks captured by one link.
Unique clickers: The number of distinct visitors who click, excluding repeat activity where possible.
Multi-click rate: The percentage of visitors who choose more than one destination in the same session.
A low page click-through rate may indicate unclear positioning, weak labels, irrelevant offers, or excessive visual noise. A high multi-click rate may reflect healthy exploration, but it can also signal uncertainty.
Position must be considered before interpreting demand. The first button has a structural advantage because it is immediately visible and often treated as the recommended choice. A lower link may appear weak simply because mobile visitors never reach it.
Wording also affects traffic quality. “Learn More” may produce curiosity clicks. “Book a 30-Minute Strategy Call” attracts fewer but more informed visitors. Comparing those labels only by click-through rate would reward ambiguity.
The better question is not which link attracts the most attention, but which attracts the right attention.
Read Distribution by Link Role
Click distribution reveals whether the page has a clear hierarchy or behaves like an unfocused directory.
If one link receives 70 percent of all clicks, it may be the strongest offer, the most visible option, or the subject of current content. If clicks are spread evenly across ten links, visitors may be exploring, or they may be struggling to find the correct destination.
Group links by function before judging them:
● Primary conversion links should lead to purchases, bookings, registrations, or subscriptions.
● Supporting links should provide information that helps visitors make a decision.
● Audience links should direct people to communities, channels, or media.
● Utility links should handle support, contact, legal, or account-related needs.
A utility link can receive little traffic and still perform its role. A primary conversion link carries more responsibility and should be evaluated against outcomes.
Distribution should also be segmented by source. Visitors from a product video may favour the featured item, while visitors from a professional network may prefer a report or newsletter. An account-wide average can hide both patterns.
Follow the Destination
A click proves only that a visitor left the bio page. It does not prove that the next page worked.
The destination is a separate experience shaped by message continuity, loading speed, mobile usability, offer clarity, trust, pricing, and the effort required to complete the action.
Three rates help isolate the problem:
Bio-page click-through rate = link clickers ÷ bio-page visitors
Destination conversion rate = completed actions ÷ destination visitors
End-to-end conversion rate = completed actions ÷ bio-page visitors
Suppose a course link receives 2,000 clicks from 5,000 visitors and produces 40 sales. The bio-page click-through rate is 40 percent, the destination conversion rate is 2 percent, and the end-to-end conversion rate is 0.8 percent.
The page clearly attracts interest. The weak point sits later in the journey, possibly in the sales page, price, checkout, audience fit, or message consistency.
Expectation gaps deserve close attention. If social content promises a free template but the button opens a paid bundle, the click is technically successful while the experience feels misleading. The post, button, and destination should form one uninterrupted promise.
Separate Volume From Conversion Quality
Not all completed actions have equal value. A newsletter sign-up may come from an engaged reader, a freebie seeker, a bot, or someone who unsubscribes the next day. A form submission may produce a qualified prospect or an enquiry with no budget and no fit. A purchase may be profitable, refunded, or followed by expensive support.
For lead generation, track the percentage of submissions accepted as relevant, the share that reaches a sales conversation, the close rate, and the average time from first visit to customer.
For newsletters or memberships, review confirmation, engagement, retention, paid upgrades, and early unsubscribe behaviour. For ecommerce, examine order value, refunds, repeat purchases, and contribution margin rather than revenue alone.
This deeper view often changes which source appears strongest. A campaign producing 500 inexpensive leads may look effective until only five are qualified. Another campaign may produce 80 leads, with 25 entering the sales pipeline.
Conversion analytics should identify which traffic creates useful outcomes, not simply which source fills the most forms.
Connect Activity to Economic Value
Revenue gives link-in-bio analytics a clearer hierarchy. A page may contain a low-cost product, a premium consultation, an affiliate link, and a free lead magnet. Each creates value on a different schedule.
| Destination | Clicks | Conversions | Immediate value | Longer-term role |
| Entry product | 850 | 61 sales | $1,220 | Introduces new buyers |
| Consultation | 140 | 8 bookings | $3,200 | Generates high-value clients |
| Free guide | 1,100 | 290 sign-ups | $0 | Builds the email audience |
| Affiliate tool | 420 | 35 purchases | $525 | Adds referral income |
The free guide leads in conversions but produces no immediate revenue. The consultation receives the fewest clicks yet creates the most direct value. The entry product may matter because it turns followers into first-time customers.
Useful value metrics include revenue per visitor, revenue per click, average order value, lead value, subscriber value, repeat purchase rate, and customer acquisition cost.
Revenue per visitor is particularly revealing because it connects traffic quality, click behaviour, and conversion performance. It also allows sources with different volumes to be compared on economic efficiency.
Immediate revenue should not become the only standard. Some links support discovery, education, or retention. Assign each link a role and judge it according to that role.
Treat Attribution as Evidence, Not Certainty
A visitor may discover a product through a social post, visit the bio page, join an email list, return through search, and purchase five days later. A last-click report may credit search. A first-touch report may credit social. Both describe part of the journey.
Instead of expecting one model to settle the question, use several views:
● First-touch reporting shows what introduced the visitor.
● Last-touch reporting shows what completed the action.
● Assisted-conversion reporting identifies channels involved before the final step.
● Cohort reporting follows groups of visitors over time.
● Incrementality testing estimates whether a campaign created additional results above the baseline.
The level of analysis should match the scale of the operation. A small creator may not need multi-touch software, but should still recognise that same-day purchases understate the value of educational content, email capture, and repeat visits. Attribution is best used to compare patterns, not claim mathematical certainty.
Build Fair Benchmarks and Reports
Generic link-in-bio benchmarks are weak because audience intent, offer type, page role, and traffic temperature vary widely. Build internal comparisons instead. Compare the same source across several campaigns, the same link before and after a position change, new visitors against returning visitors, and one launch period against another launch period.
Rolling averages reduce overreaction to a viral post or unusually weak day. Add annotations when a link moves, a campaign begins, or the page design changes.
Reporting frequency should match the decision:
● Weekly reports should surface operational changes such as traffic shifts, broken links, click-through changes, and unusual mobile behaviour.
● Campaign reports should compare source quality, cost, conversion, revenue, and destination performance.
● Monthly reports should review revenue per visitor, lead quality, subscriber retention, repeat purchases, and assisted value.
● Quarterly reviews should challenge whether the page structure still reflects current priorities.
A useful report ends with a decision: remove a low-value distraction, move a profitable link, rebuild a weak destination, correct campaign tags, or test a clearer label. Without that step, reporting becomes record keeping.
Diagnose Before Redesigning
Analytics should narrow the likely cause before changes are made.
| Pattern | Likely cause | Best place to investigate |
| Strong profile activity, weak page visits | The profile call to action is unclear or unrelated | Bio copy, pinned content, and call-to-action language |
| Strong page visits, weak clicks | The page lacks hierarchy or relevance | Link order, labels, headline, and number of choices |
| Strong clicks, weak destination conversion | The promise breaks after the click | Landing-page message, pricing, speed, forms, and checkout |
| Strong conversion, weak revenue | The offer value or order size is low | Product mix, pricing, bundles, and upsells |
| Strong first purchase, weak repeat behaviour | The page attracts one-time demand | Product fit, onboarding, and retention |
| Mobile traffic drops sharply | The experience is difficult on small screens | Load time, tap targets, layout, and form length |
A low click-through rate does not always mean the page design is poor. The traffic may come from content that never prepared the visitor for an offer. A low conversion rate does not always mean the landing page is weak. The audience may be broad, curious, and commercially unqualified.
The metric identifies the stage. Segmentation and qualitative review identify the cause.
Design Tests Around Decisions
Testing should begin with a diagnosis and a clear hypothesis:
Because the data shows [specific problem], changing [one variable] should improve [target metric] while protecting [downstream result].
For example:
Because visitors from product tutorials click the featured item but abandon the sales page, aligning the landing-page headline with the tutorial promise should improve destination conversion without reducing click volume.
Useful tests include moving one high-value link, replacing a vague label, reducing competing choices, creating source-specific landing pages, shortening a form, or adding proof near a high-consideration offer.
Do not judge a test by click-through rate alone. A sensational label may attract more clicks while reducing purchase intent. The primary metric should follow the measurement contract, while a guardrail metric protects quality.
For a sales test, purchase conversion may be primary while refund rate acts as the guardrail. For a newsletter test, completed sign-ups may be primary while early unsubscribe rate protects subscriber quality.
Record the audience source, campaign conditions, page version, and result. A test without context is difficult to repeat and easy to misinterpret.
From Numbers to Direction
Link-in-bio analytics is valuable because it shows how social attention moves through a controlled handoff. Traffic reveals who arrived. Page behaviour reveals what they noticed and chose. Destination data reveals whether the promise held. Conversion quality and economic value reveal whether the action mattered.
That chain can show that the traffic source is wrong, the page hierarchy is weak, the label is misleading, the destination creates friction, or the offer has limited value. Each diagnosis requires a different response. The strongest measurement system does not collect every available number. It connects the right evidence to the next decision.


Comments